Reporting Options
Takeaway
Mutiny provides historic and real-time reporting of data gathered from polled devices
Graphing
Reporting is important in any management situation and infrastructure is no exception. Being able to spot a trend, justify an upgrade, find application problems or simply report on the current state of play is an important, but often tedious task.
Mutiny has a variety of methods to arm the user with the necessary data required to satisfy the majority of reporting needs. But when the complex format of reports is required, Mutiny provides the raw data in an exportable CSV format, allowing the user to format or re-import the raw data into the reporting tool of choice.
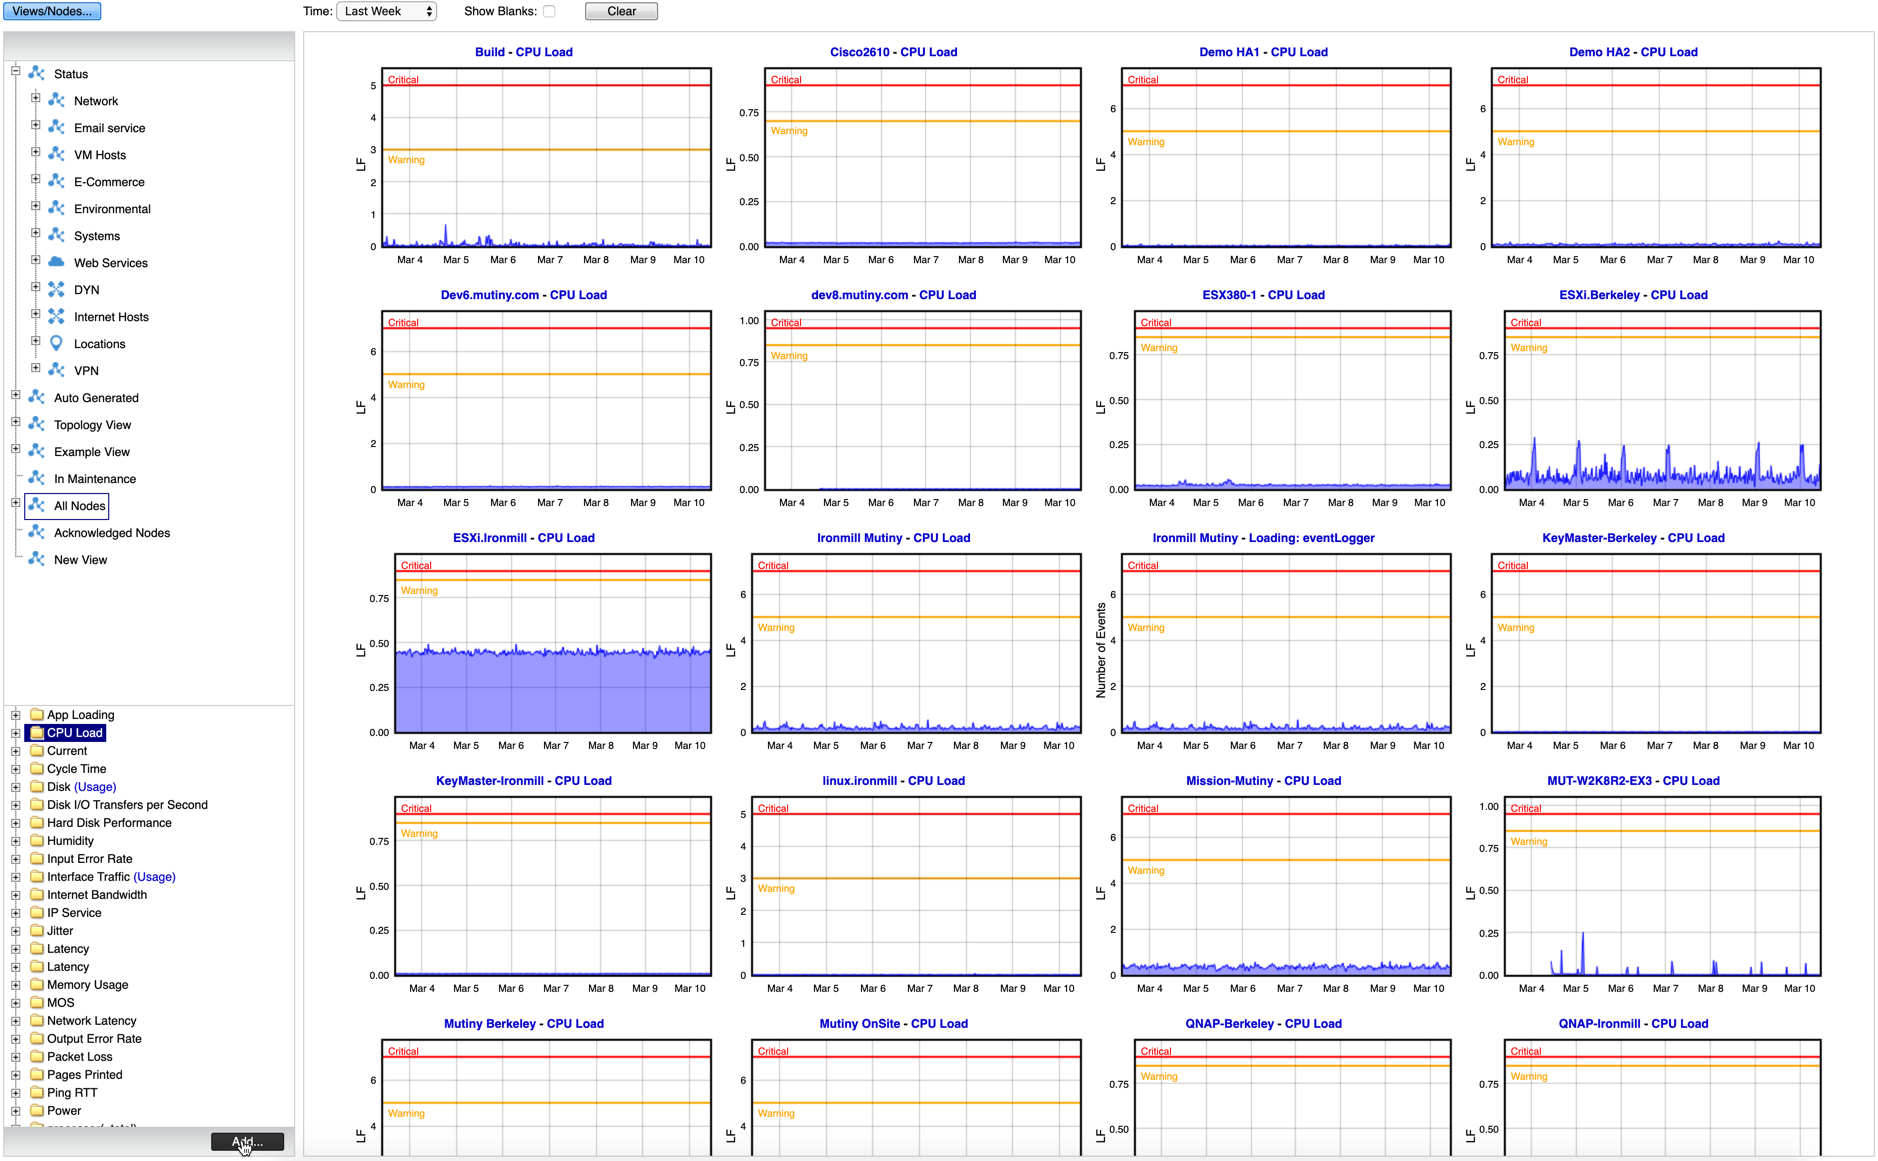
Using the data collected every polling cycle, Mutiny can produce graphs for any given period. Auto-averaging in real-time means that you always have access to the real peaks, however long ago they were recorded.
All graphing data is available as a CSV output directly from the browser.
CPU Graph

The CPU graph allows Managers to assess the current level of load any given node is experiencing. Whether you are looking at the daily peaks and assessing whether they are up to their daily duties, or looking long-term at a constant rise in load, the business can plan long-term on the viability of its hardware investment.
Memory Graph

In a similar way to that of CPU graphs, the information displayed in the memory graphs can be vital in picking up issues on a particular node, like application memory leaks, terminal server overloads.
Disk Graphs

Whether you are reacting to a critical disk alert or just auditing the overall capacity of the hard drives on your critical nodes, these graphs will allow the Managers to assess the long-term capacity needs.
Interface Traffic Graphing

Traffic data can be stored from interfaces on Servers as well as router or switch interfaces.
There is also an option to display this as real-time Dials.

Unlike a number of our competitors, Mutiny keeps all the data gathered during polling in its original form, allowing us to draw accurate graphs for any given time period. In addition, the raw data can be downloaded in CSV form for use in external reporting tools.
Quick Reports
Build an instant view of monitored properties by selecting from your Nodes, Views and properties.
Event Log

Mutiny keeps a log of all events that occur on the monitored network. The detail part of each event uses a series of unique ID numbers to allow for the matching of paired events. In addition to this detail, the time between the IDs is calculated and displayed as time in brackets. This provides an instant SLA feedback.
Event Log CSV output
The CSV output is useful for producing an overall SLA report showing, for example, the availability of all Servers or all WAN links, etc.
Formal Reporting
If you require a formatted pdf report for capacity or SLA then consider our automated SLA Reporter Module


